Discover the Pimenko Feedback Radar plugin : a powerful Moodle report plugin designed to transform Feedback activity data into actionable visual insights !
Presentation #
Pimenko Feedback Radar extends Moodle’s native Feedback activity by adding a powerful visual analytics layer. Based on rated multichoice – single answer questions organized by label, it automatically calculates average scores per category and displays them as an intuitive radar chart. Teachers and administrators can instantly compare individual performance against group and course averages, spot trends at a glance, and export comprehensive reports for further analysis, all without leaving Moodle.
In short, with the ‘Feedback Radar report‘, you can :
- Visualize Feedback activity results as a radar chart, organized by label, skill categories or thematic groups
- Automatically group rated multichoice – single answer questions sharing the same label and calculate their average score per category
- Compare three levels of results at a glance : the individual learner’s average, their group’s average, and the global average across all participants in the course
- Export data as CSV for deeper analysis : detailed responses per learner, thematic averages per user, per group, or across all participants

Plugin’s information #
Plugin Type: Report
Official plugin name : report_pimenkofeedbackradar
Moodle Compatibility: Moodle 4.5 and later versions
Dependencies: Requires Feedback activity module
Maintenance: Actively maintained by Pimenko
Key features #
 For teachers & administrators #
- A summary table of all participants’ scores, organized by question category (label)
- The average score per label, calculated automatically for each learner
- Group filtering to compare results across different learner groups at a glance
- Direct access to individual learner responses from the summary view
Radar chart visualization #
- A visual radar chart representing average scores across all question categories simultaneously
- Three comparison levels displayed in a single view : individual learner average, group average, and global average across all participants
- An intuitive shape that makes it easy to identify strengths and gaps at a glance
Administrator settings #
- Show/hide comparison levels on the radar chart : user average, group average, and course average can each be toggled independently
- Define a list of excluded answers
Comprehensive CSV Exports #
Export data in multiple formats for external analysis:
- Export detailed individual answers for all participants
- Export average scores per label : by user, by group, or for all participants combined
- A ready-to-use format for further analysis in any spreadsheet tool
Perfect for creating custom reports, conducting statistical analysis, or archiving results.
Anonymity support #
Respects Moodle’s Feedback activity anonymity settings:
- Anonymous responses are included in global statistics
- Anonymous data is excluded from individual user tables
- Maintains privacy while providing valuable aggregate insights
Customizable exclusions #
Administrators can specify which answer values should be ignored in the score calculation, ensuring that non-committal responses do not skew the averages. Common exclusions include:
- “N/A” (Not Applicable)
- “I don’t know”
- “Prefer not to answer”
- Any custom labels
This ensures that calculations reflect only meaningful responses, improving data accuracy.
Benefits #
- For teachers : Monitor your learners’ performance category by category, compare individual results against group and course averages, and identify collective strengths or gaps without digging through raw data
- For administrators : Keep full control over what is displayed and how averages are calculated — exclude irrelevant answers, adjust the radar chart visibility, and ensure the results shown are always meaningful
- For everyone : Export clean, ready-to-use data in CSV at any time, whether for individual follow-up, group reporting, or institutional analysis
Getting started #
Ready to transform your Feedback activities into visual insights?
- Install the plugin from the Moodle plugins directory
- Create a Feedback activity with categorized questions
- Collect responses from your students or participants
- Visualize results with automatic radar chart generation
- Act on insights to improve your courses
How to set up my Feedback activity effectively ? #
The “Feedback” activity example, illustrated by the various screenshots below, relates to the assessment of a company’s performance. It is intended for all the employees.
Here is an example of question that you can create :
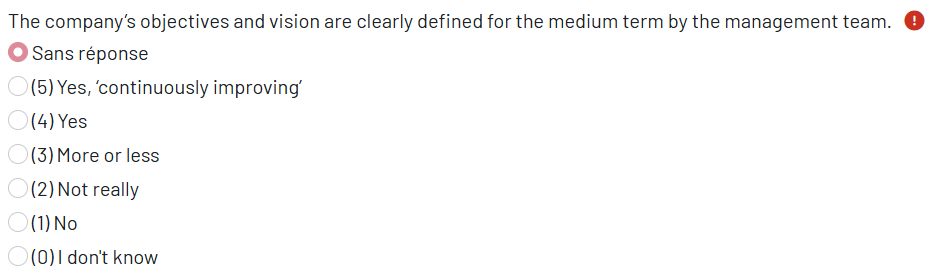
You need to choose the question type ‘Multiple choice (rated) – single answer’ and enter response values using a numerical scale (where 5 corresponds to the highest response level and 0 to the lowest).
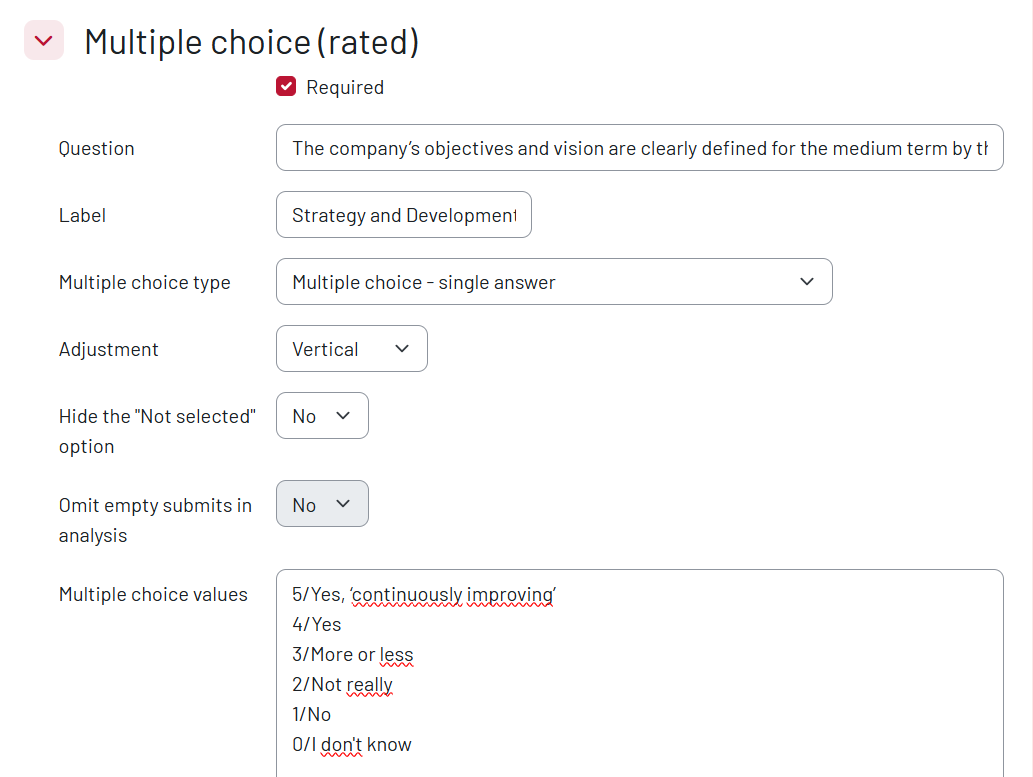
Here’s how the question will appear for the user :
Where to find the report containing the participants’ responses, and what does it contain? #
Step 1. In your course, click on the ‘More’ tab, then on ‘Reports’
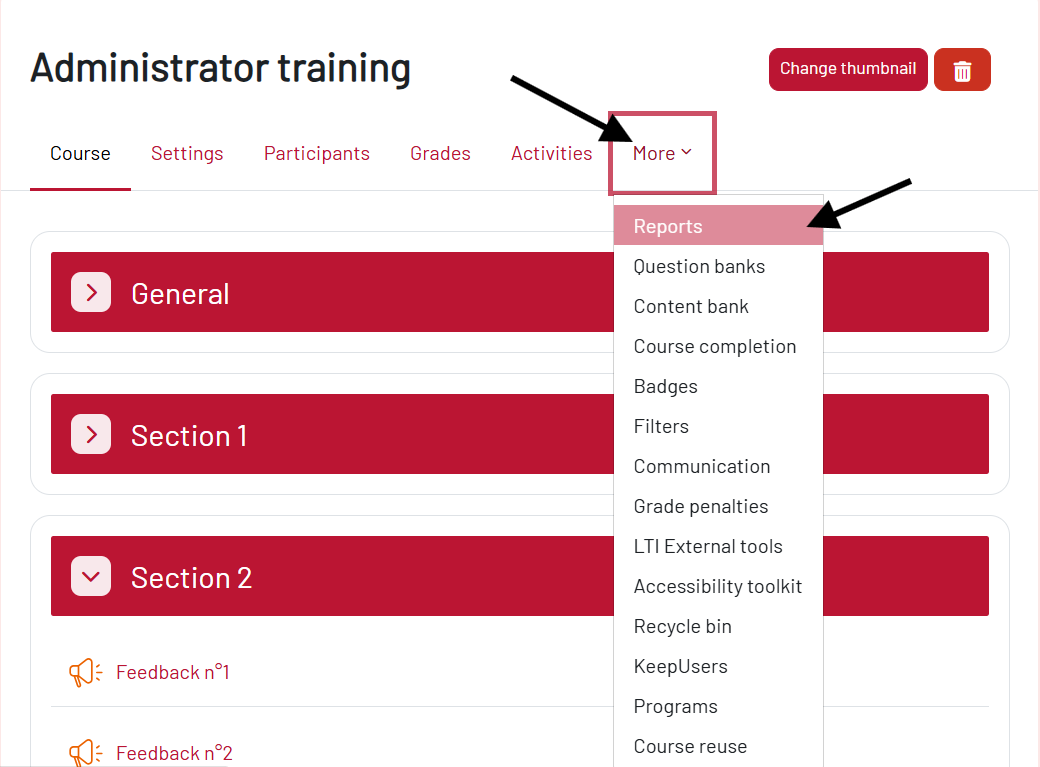
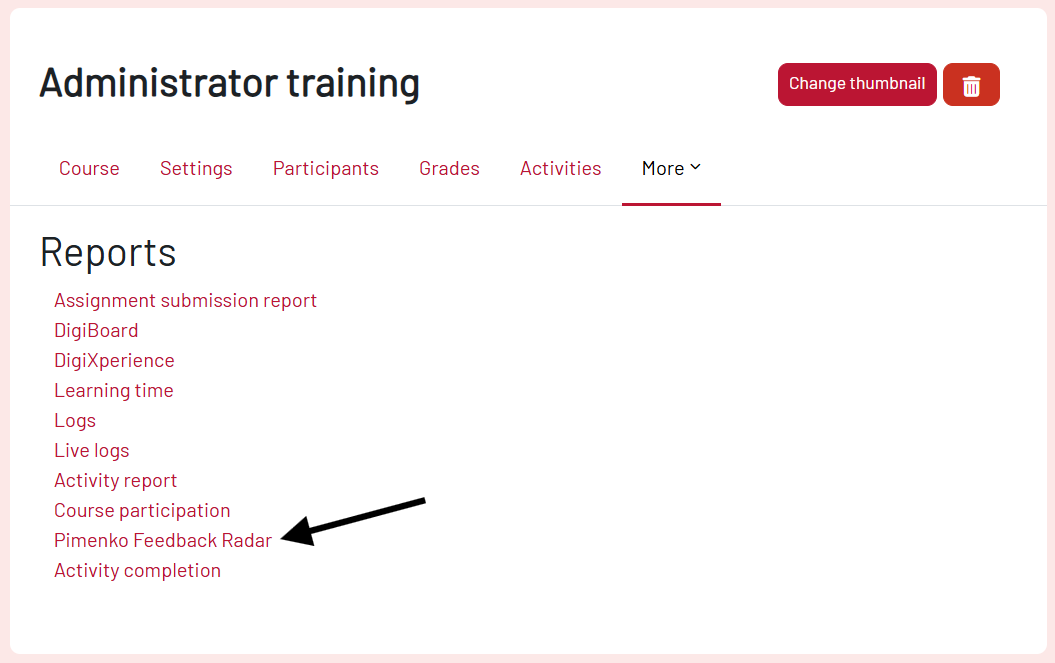
Step 2. In the Reports page, click on the ‘Pimenko Feedback Radar’ item
View the summary report for all participants #
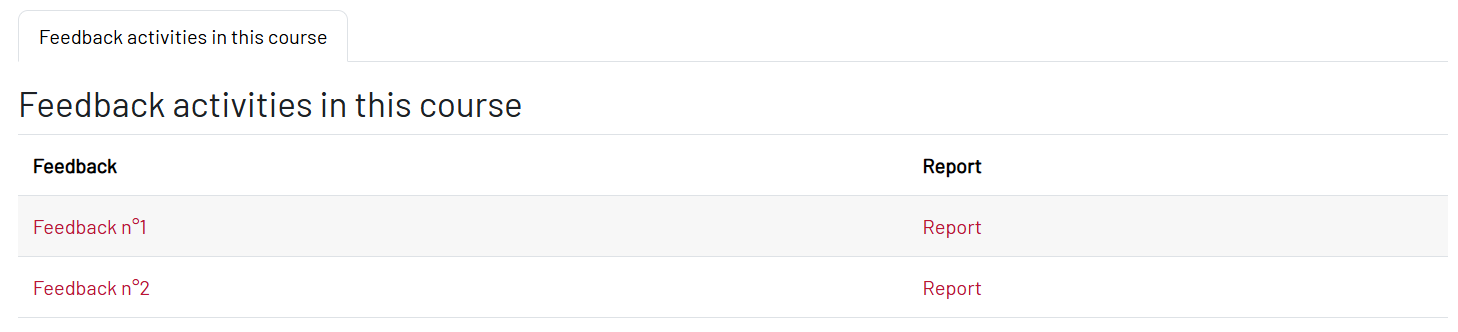
Step 3. In the page opening, you can find the list of the Feedback activities within your course
- If you click on the name of the Feedback, you will be redirected to the activity itself
- If you click on the item ‘Report‘, you will be redirected to the report on participants’ responses
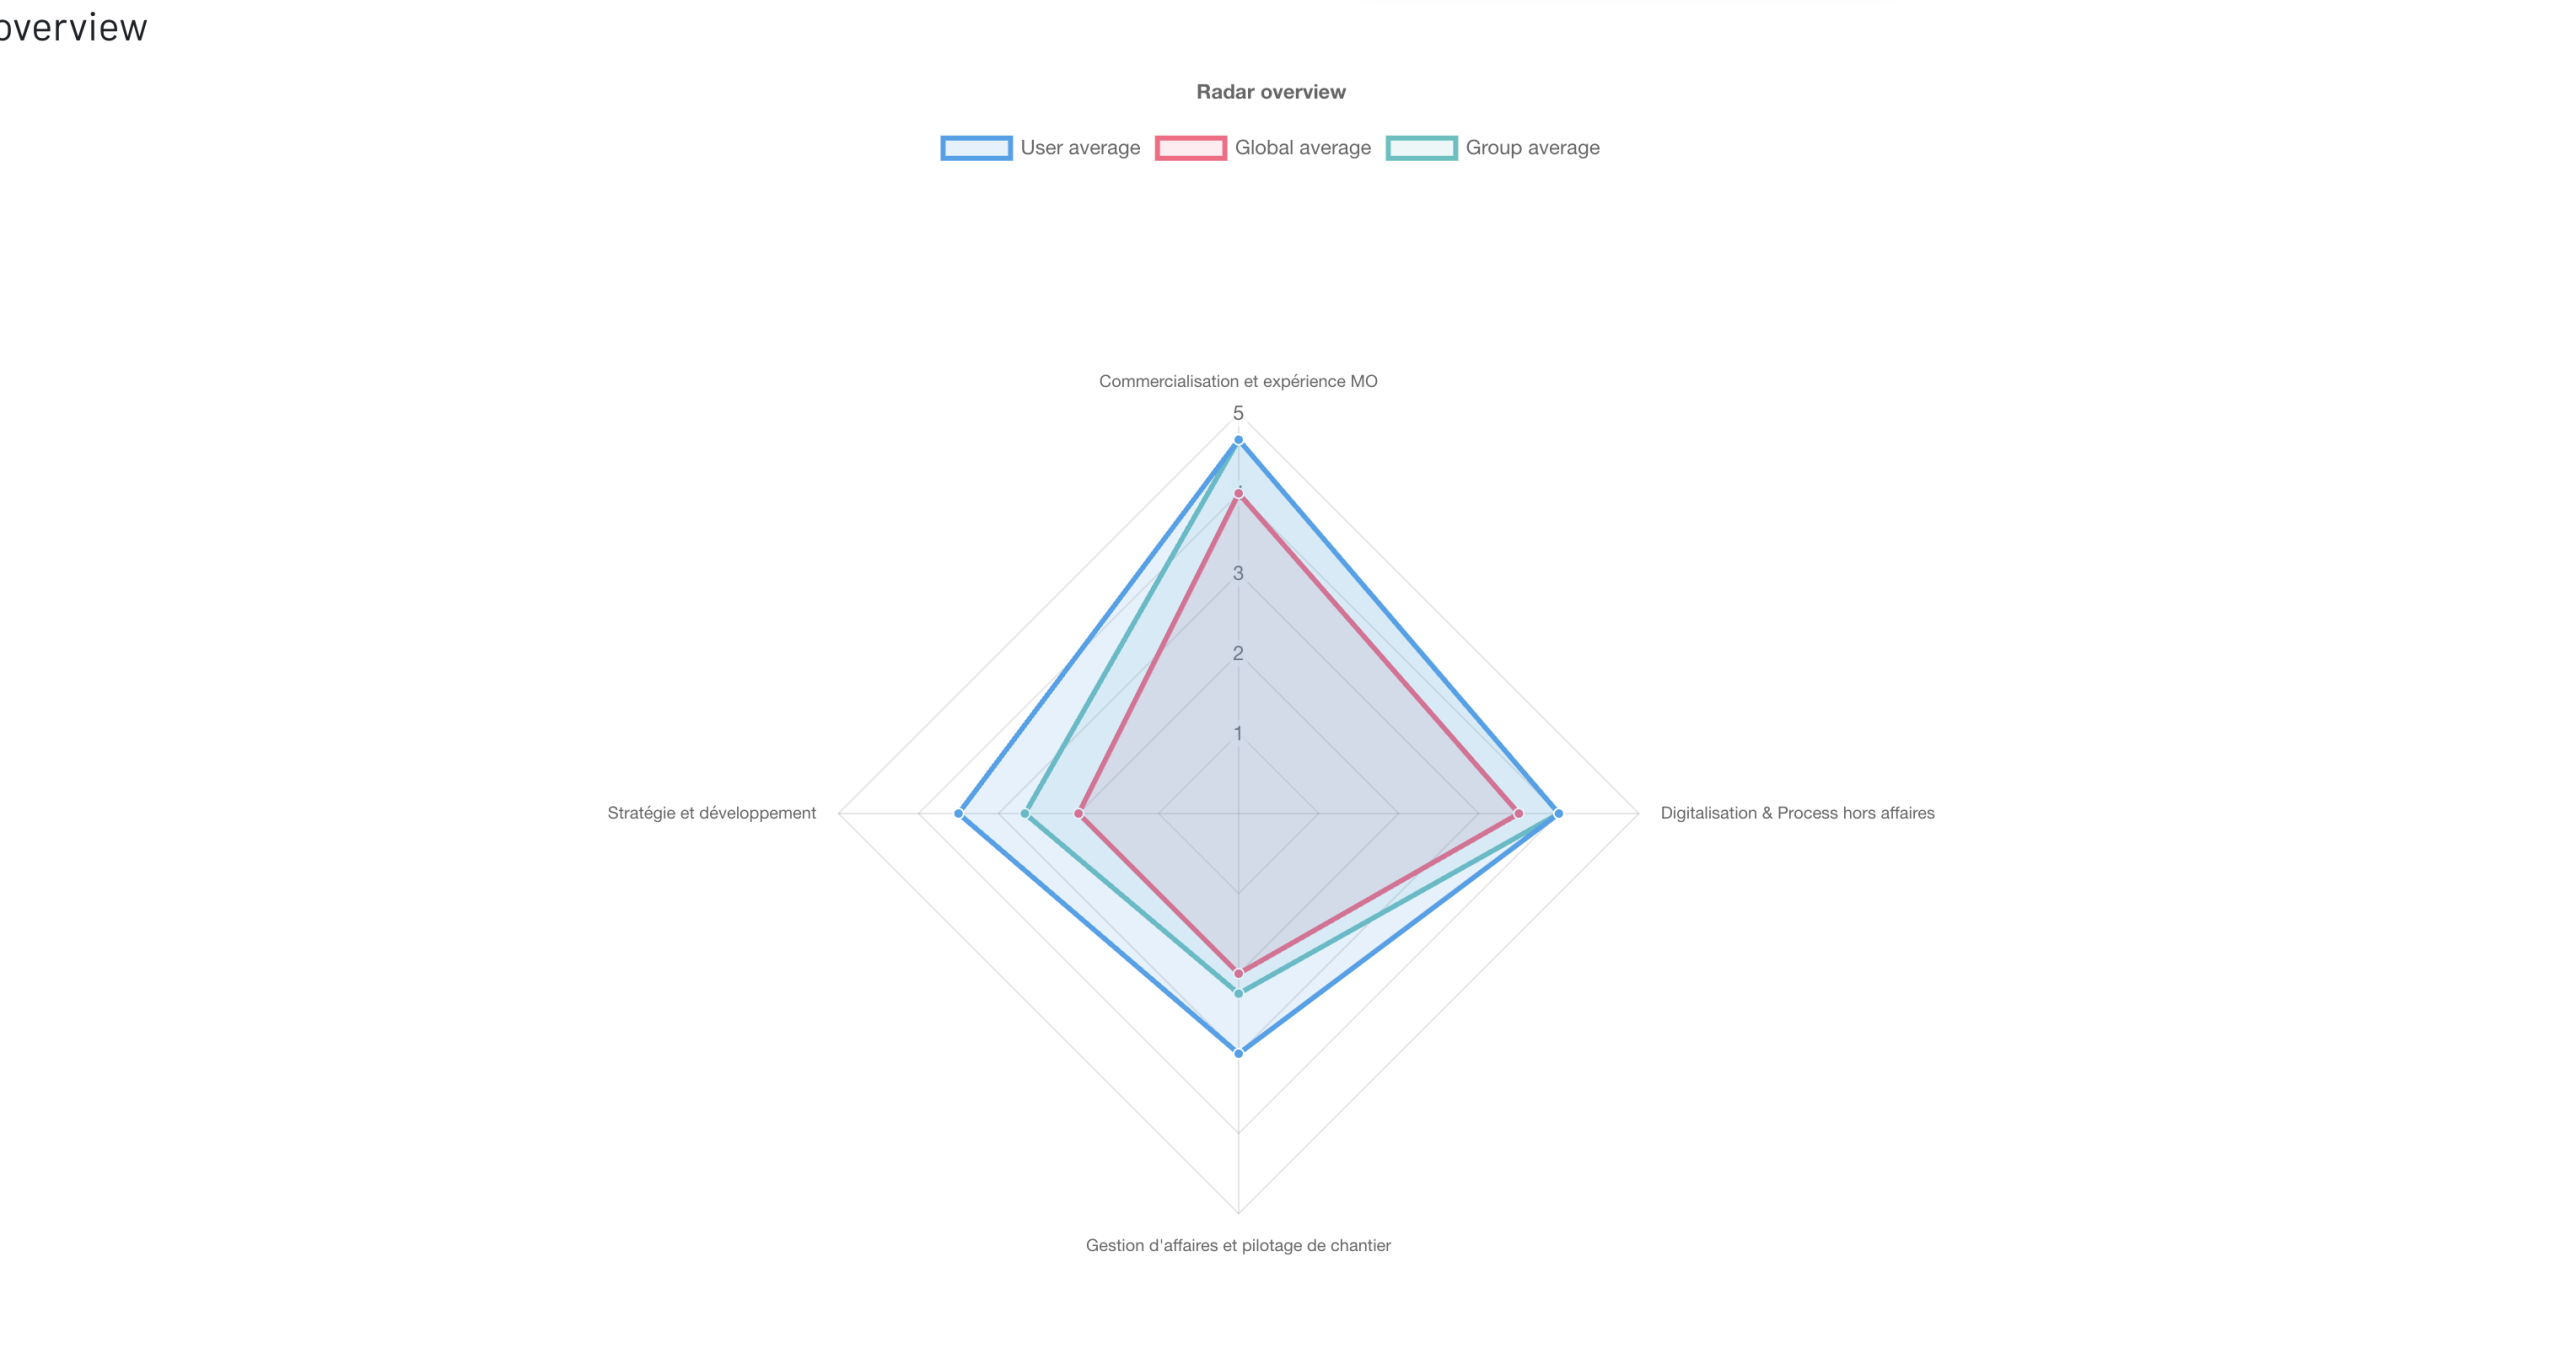
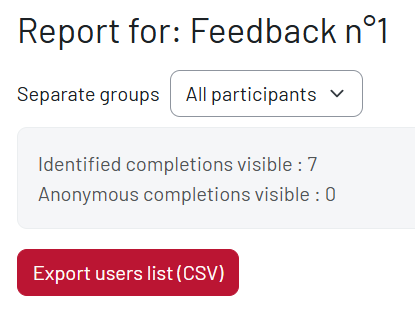
Then, the global report appears, with the number of completions, an export button to get a csv file.
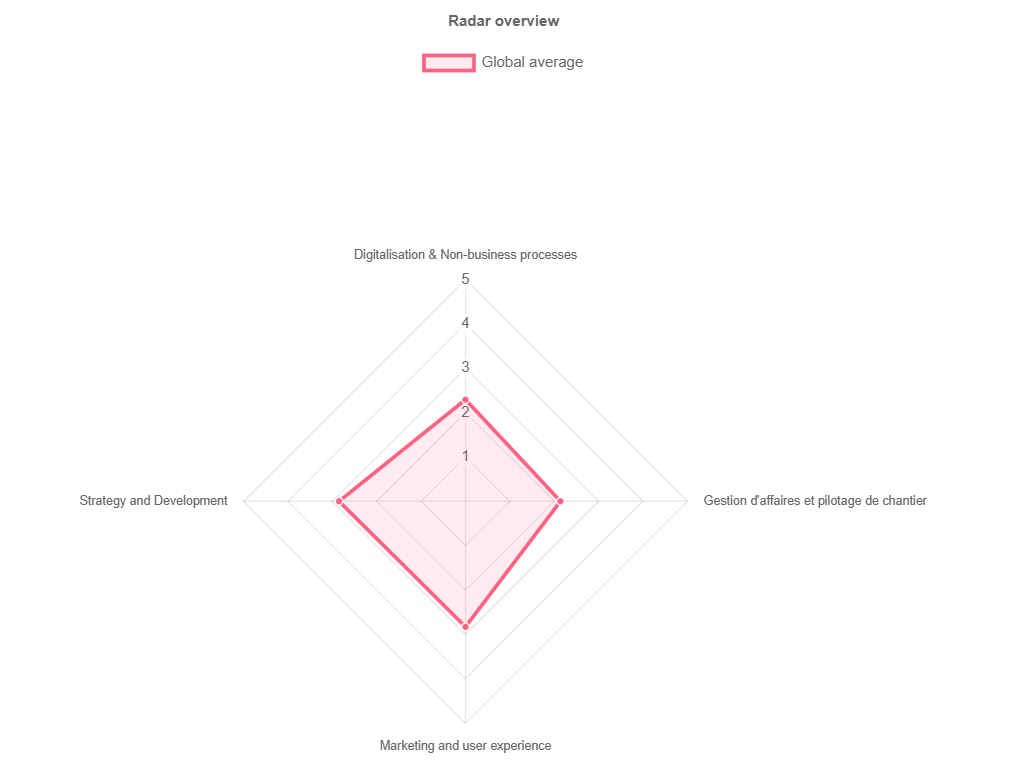
You can also see a ‘Radar overview’ of the global results.
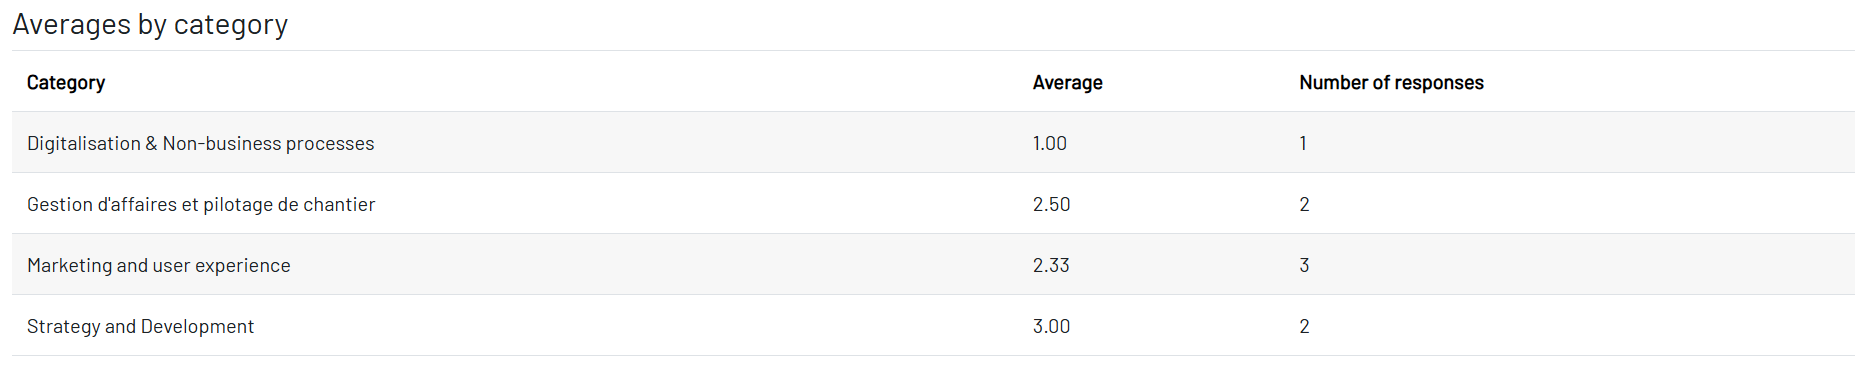
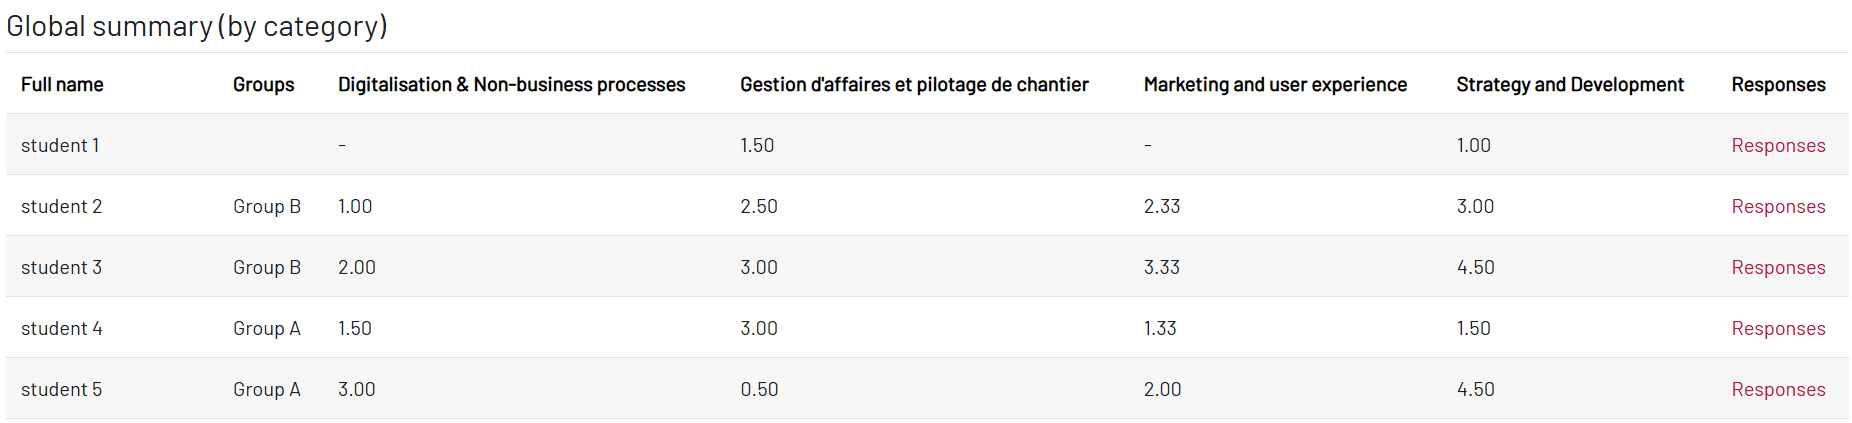
Below, you will find the averages by category for each respondent.
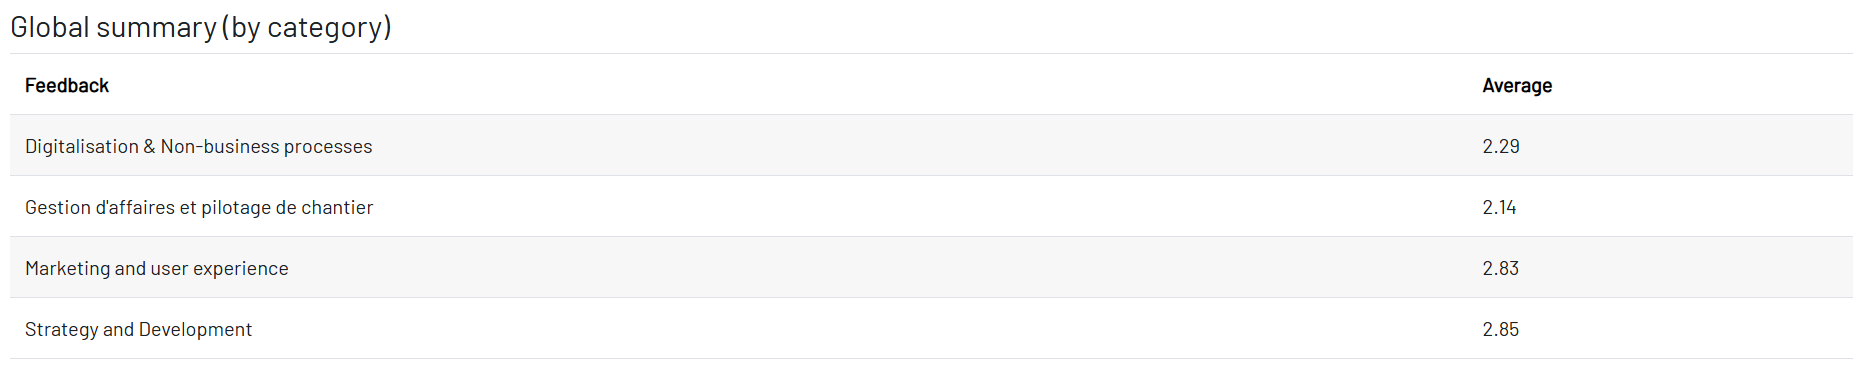
And finally, the overall averages by category.
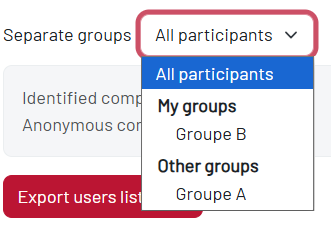
You can use the ‘seperate groups’ filter to sort the participants, if you need.
View a specific participant’s report #
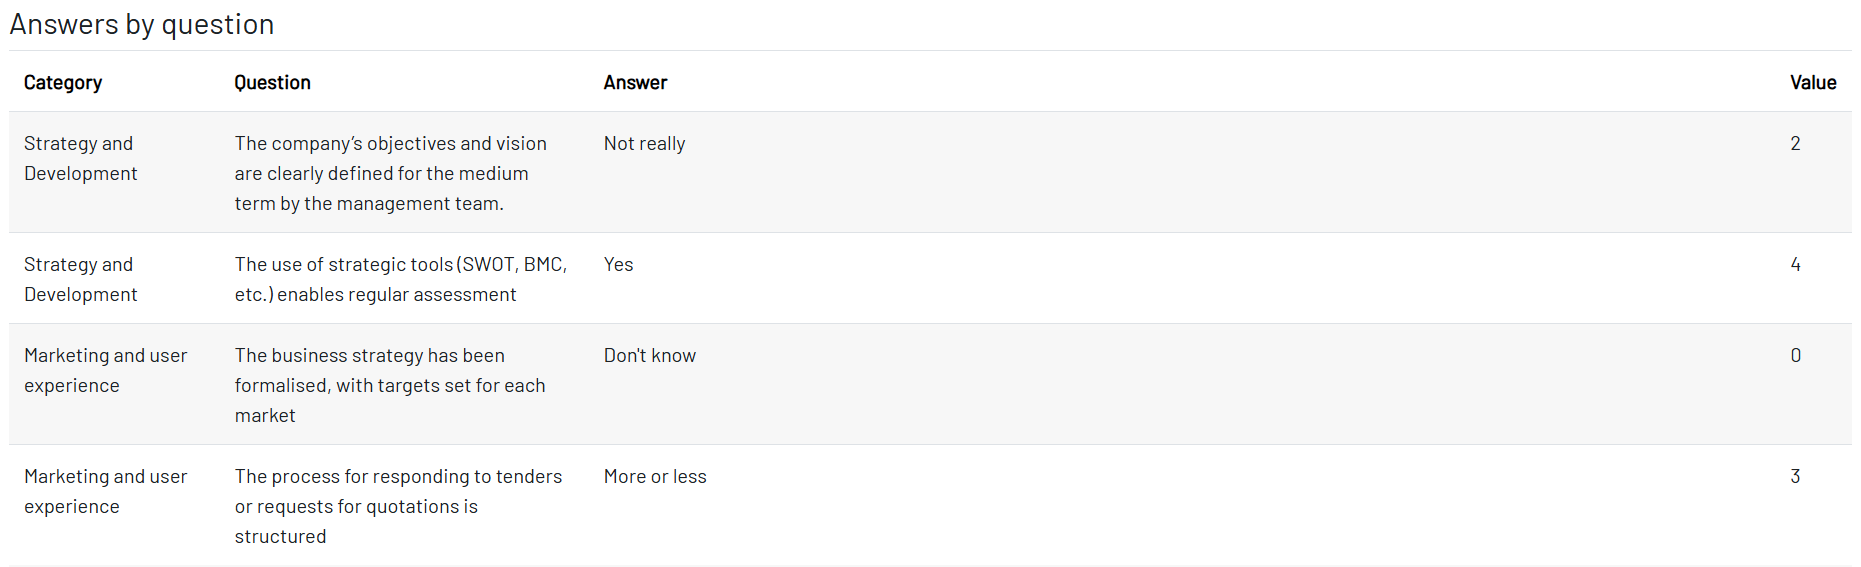
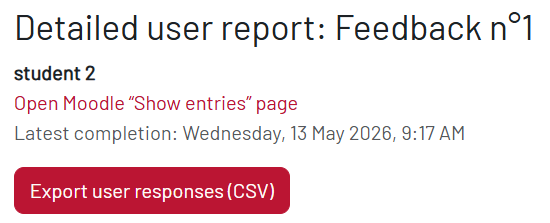
Step 4. Click on the ‘responses’ button of the student of your choice to view his detailed answers.
You will find an export button to get a csv file with the detailed report.
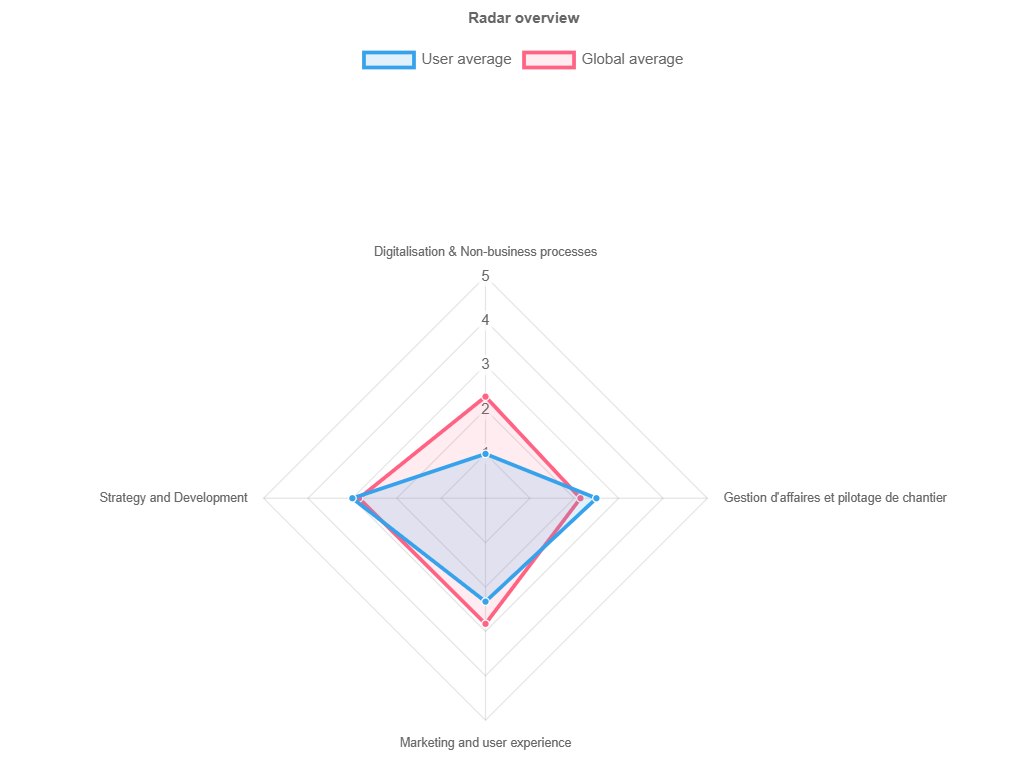
As for the global report, a ‘Radar overview’ of the global results is available, along with the user’s overall average.
Below, you will find the detailed answers of the user and the averages by category for the same user.