The built-in reports for the Feedback activity in Moodle work well with a small number of respondents and questions. Once you have multiple groups, dozens of questions, and thematic categories, they become difficult to navigate.
Feedback Radar transforms this raw data into a clear radar chart and analysis tables that provide an at-a-glance comparison—all without leaving Moodle or needing to export the data first.
Overview #
Feedback Radar is a reporting plugin for Moodle that enhances the native Feedback activity. It takes your multiple-choice questions (graded) and groups them by tag—that is, the thematic categories you assign to your questions (for example: “Communication,” “Organization,” “Technical”). It automatically calculates the average score for each category and displays the result as a radar chart. At a glance, teachers, managers, and administrators can compare a learner’s results with those of their group and the overall course average without exporting data or leaving Moodle.
In short, with the Feedback Radar plugin, you can:
- Display the results of the Feedback activity as a radar chart, sorted by question category (label)
- Automatically group multiple-choice questions (graded) within the same category and calculate their average score
- Compare three levels of results in a single graph: the average per learner, the average per group, and the overall average for all participants
- Export data to CSV format for further analysis: detailed responses by learner, topic-based averages by user, by group, or for all participants
Plugin Information #
Plugin type: Report
Official plugin name: report_pimenkofeedbackradar
Compatibility: Moodle 4.5 and later versions
Prerequisite: Feedback Activity
Maintenance: Pimenko
What sets this plugin apart from Moodle’s native reports #
Moodle provides a built-in results report for the Feedback activity. This report displays responses on a question-by-question basis and calculates overall averages, but it has significant limitations when the data becomes more complex:
- No grouping by topic: all questions are listed in a flat structure
- No visual representation that allows for a quick assessment of strengths and weaknesses
- No side-by-side comparison of students, groups, and courses in a single view
- No distinction is made between neutral responses (“I don’t know,” “N/A”) and relevant responses in the calculation of averages
Feedback Radar enhances the analysis of results directly within Moodle, without the need for external tools or prior exporting. Simply assign a label to each question in the Feedback activity, and the plugin will automatically aggregate, calculate, and display the results.
Key features at a glance #
 Overview by topic #
The main report displays a summary table listing all participants’ ratings, grouped by label (thematic category):
- The average score per label, calculated automatically for each learner
- Group filtering to compare results across groups of learners at a glance
- Direct access to each learner’s answers from the summary view
Radar chart #
A radar chart, also known as a “spider chart,” displays multiple categories on separate axes. The larger the area covered, the higher the results. This visual format is particularly well-suited for comparing multiple dimensions at the same time.
The Feedback Radar chart shows:
- Average scores for all question categories, in a single chart
- Three levels of comparison: the average per learner, the average per group, and the overall average for all participants
- An intuitive overview that lets you identify strengths and areas for improvement at a glance
CSV Export and Anonymity #
Available exports:
- Detailed responses from each participant
- Average ratings by tag: by user, by group, or for all participants
- Ready-to-use format for analysis in any spreadsheet program
The plugin complies with the privacy settings for the Feedback feature:
- Anonymous responses are included in the overall statistics
- Anonymous data is excluded from tables relating to individual users
- Confidentiality is maintained while providing actionable aggregated information
Administrator settings #
Administrators have two configuration options:
- Show or hide comparison levels on the radar chart: the average per user, the average per group, and the average per course can be turned on or off independently
- Define a list of responses to exclude from average calculations to prevent evasive answers from skewing the results (examples: “N/A,” “I don’t know,” “Prefer not to answer,” or any custom wording)
Step-by-step guide to using Feedback Radar #
Here’s how to set up Feedback Radar, from configuring the activity to viewing the report.
How do I set up my “Feedback” feature? #
For Feedback Radar to work, two conditions must be met in your Moodle Feedback activity:
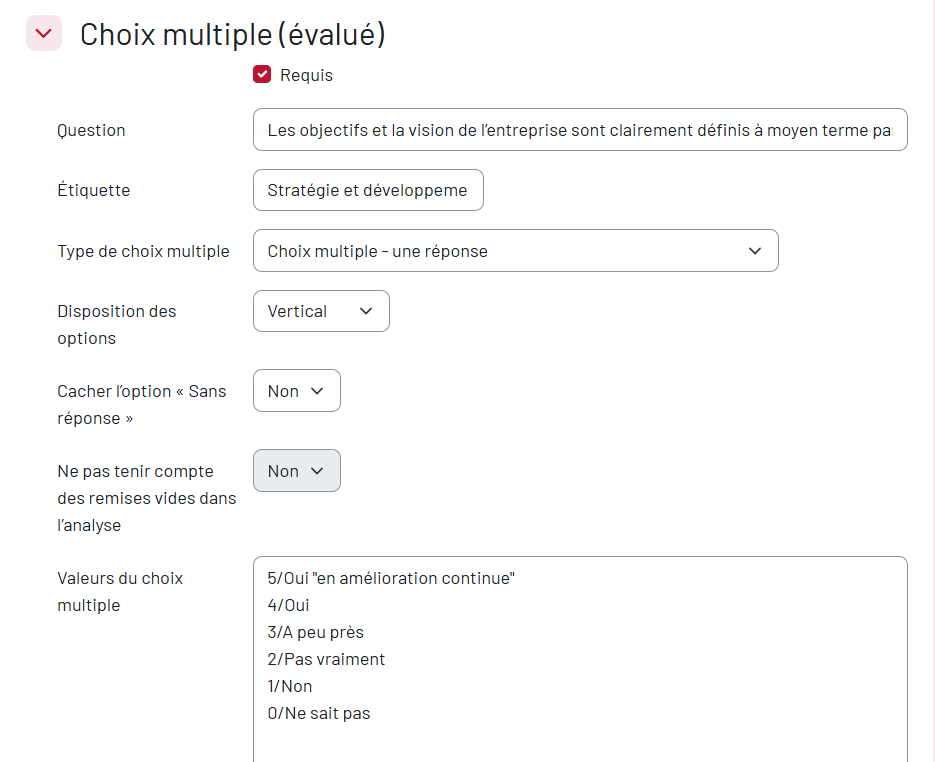
- Questions must be multiple-choice (scored), displayed as radio buttons or drop-down lists, with a numerical value assigned to each answer (e.g., 0 = lowest, 5 = highest).
- Each question must also have a label (i.e., the field called “label” in a Moodle feedback activity), which will serve as the category name in the report.
The example below concerns a company’s performance evaluation, intended for all employees.
Here is an example of a question you could create. You must select the “Multiple Choice (Graded)” question type and enter the response values using a numerical scale (where 5 corresponds to the highest response level and 0 to the lowest).
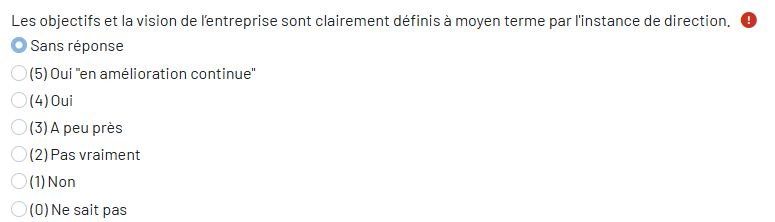
Here is how the question appears to the user:
Access the Feedback Radar report and understand what it contains #
Step 1: From the submenu on your course homepage, click the “More” tab, then click “Reports.”
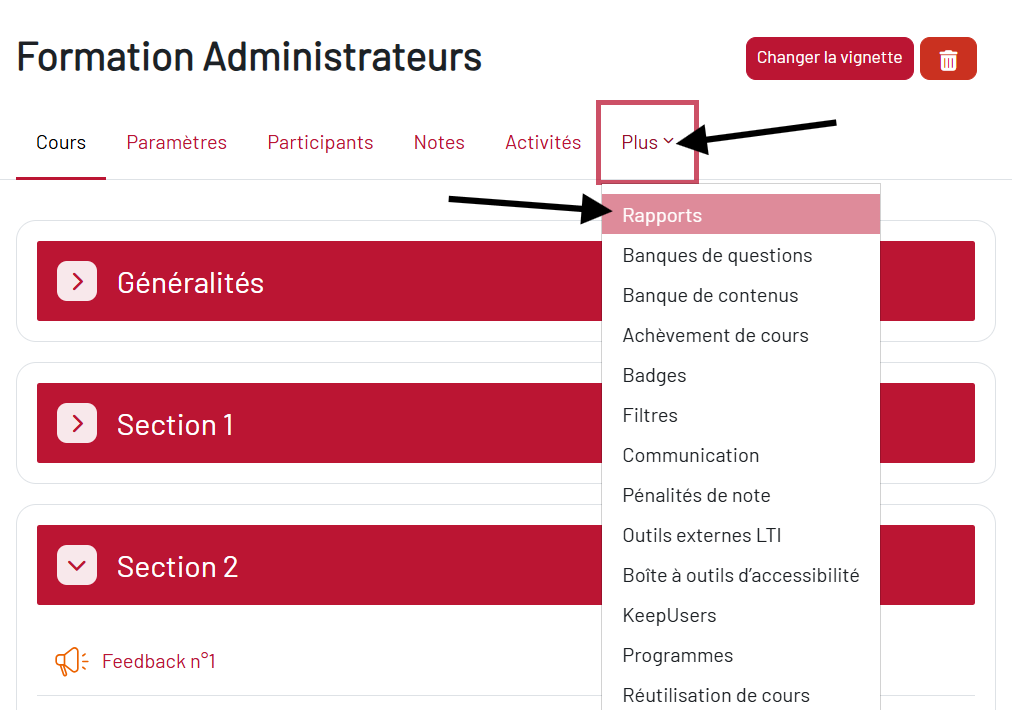
Step 2: On the Reports page, click “Pimenko Feedback Radar”
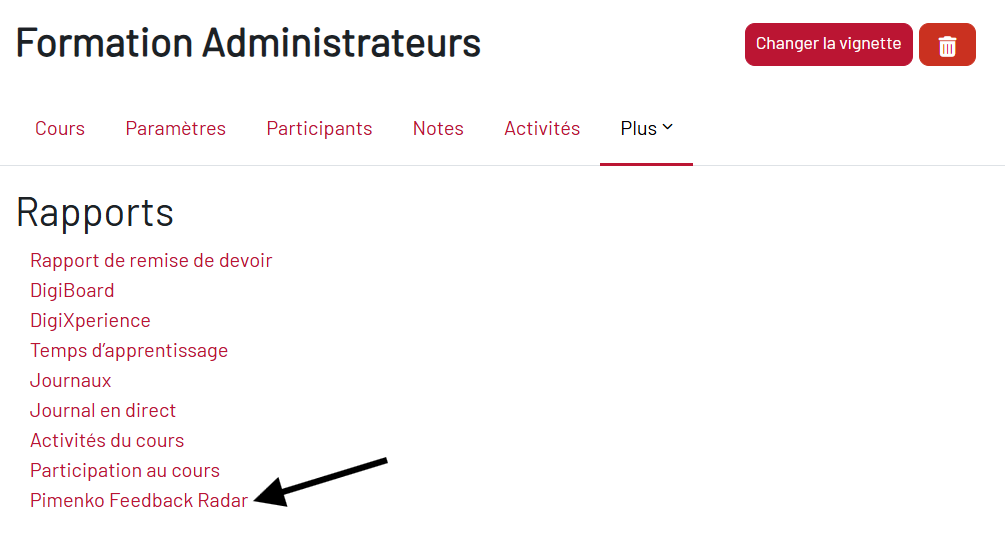
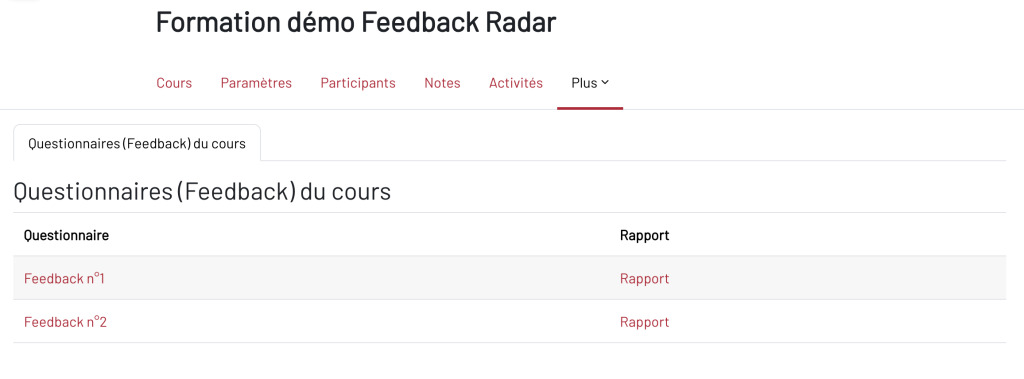
Step 3: The “Course Surveys (Feedback)” page appears. It lists all the Feedback activities in your course. Click “Report” next to the activity you want to analyze.
View the full report #
You will be taken to the Feedback activity report page, which displays the “Overall Report” tab. This page is divided into several sections.
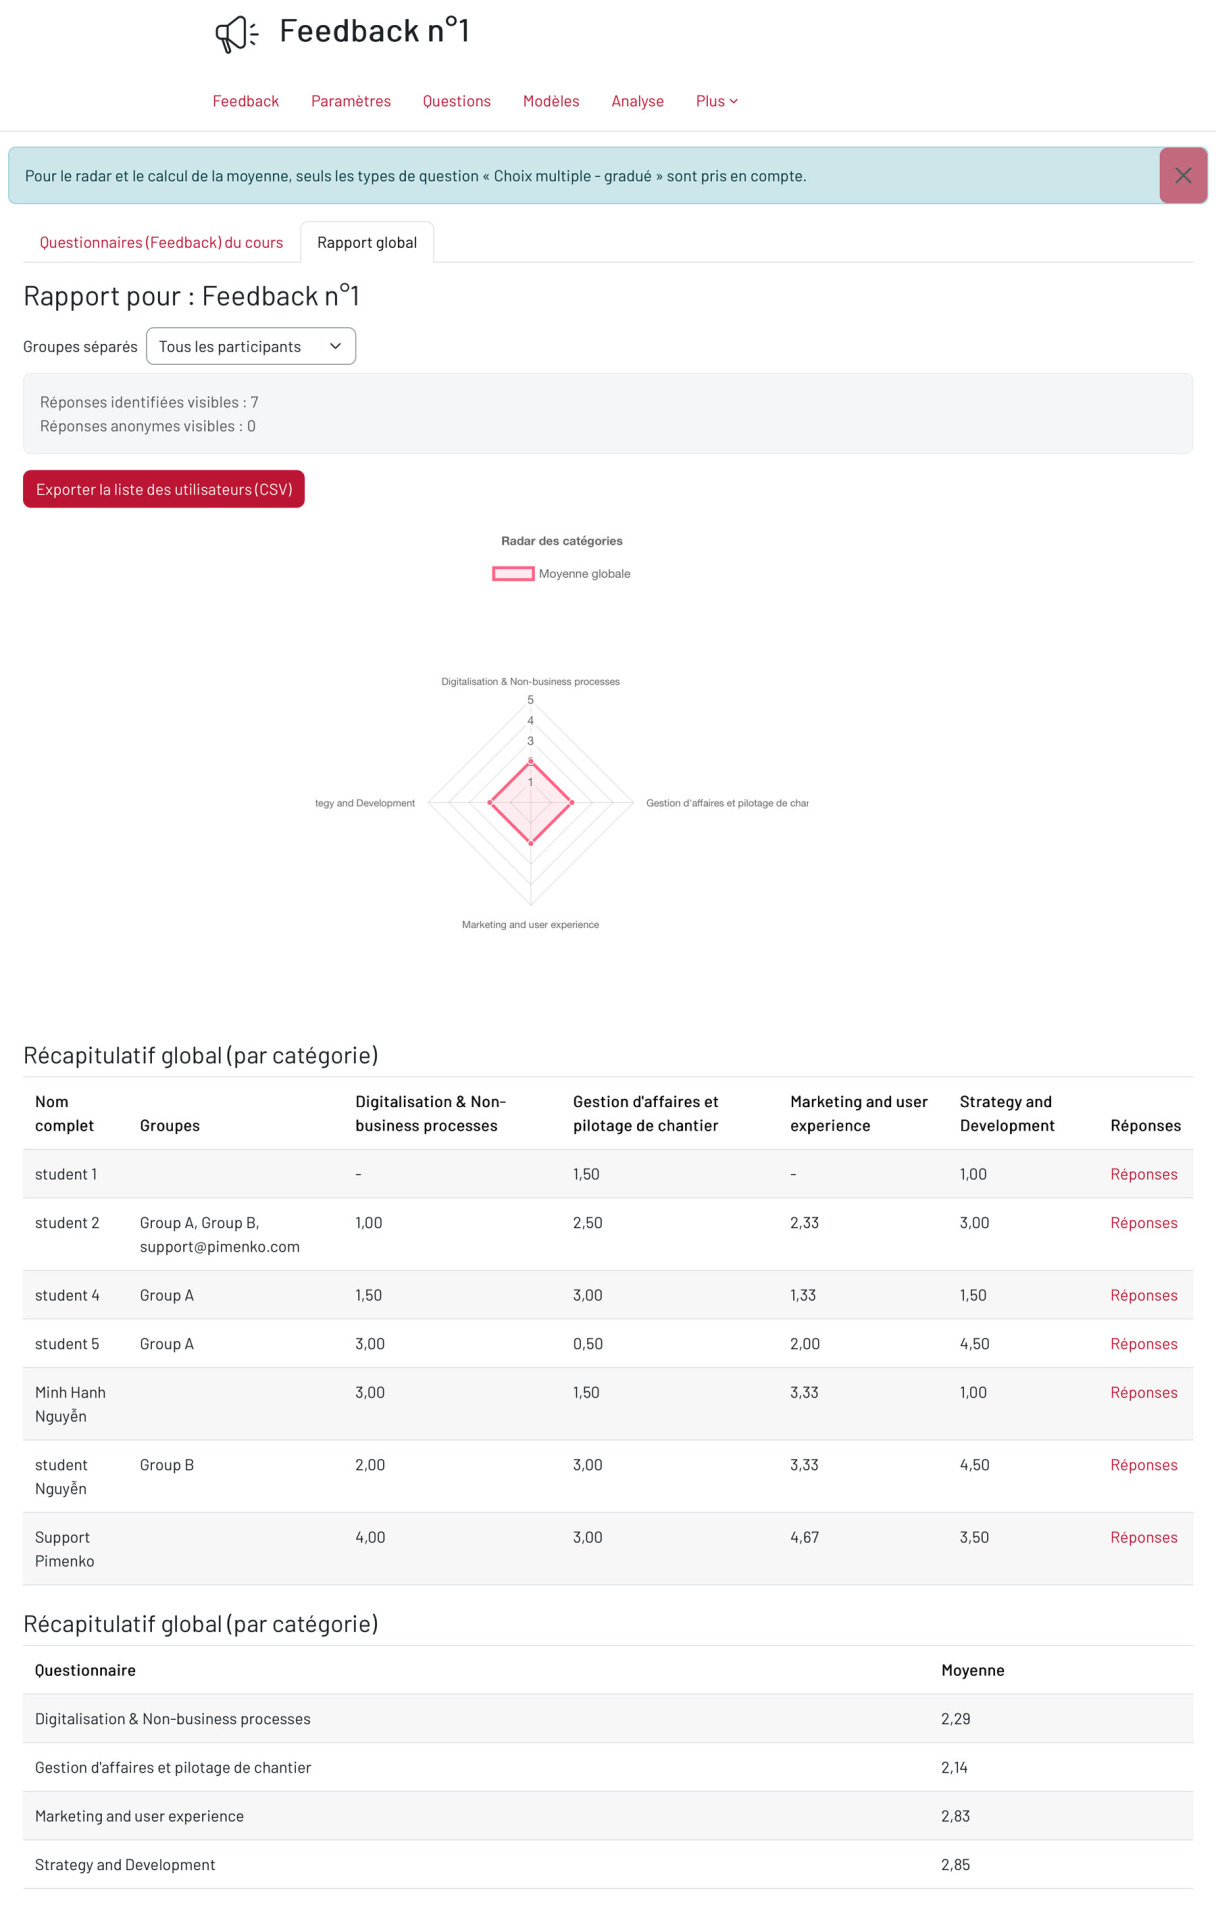
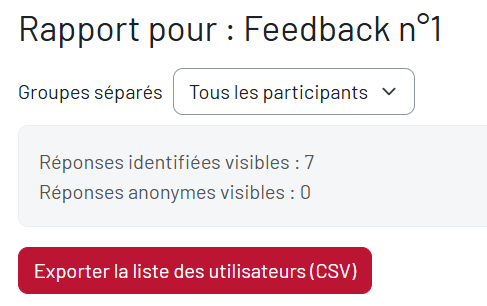
At the top of the page:
- A “Separate Groups” filter: if groups have been set up in the course, you can filter to display only the results for a specific group
- The number of identified and anonymous responses
- A “Export User List (CSV)” button to download all scores by category
Note: Only “Multiple Choice – Graded” questions are included in the calculation of averages and in the radar chart. Other types of questions are ignored.
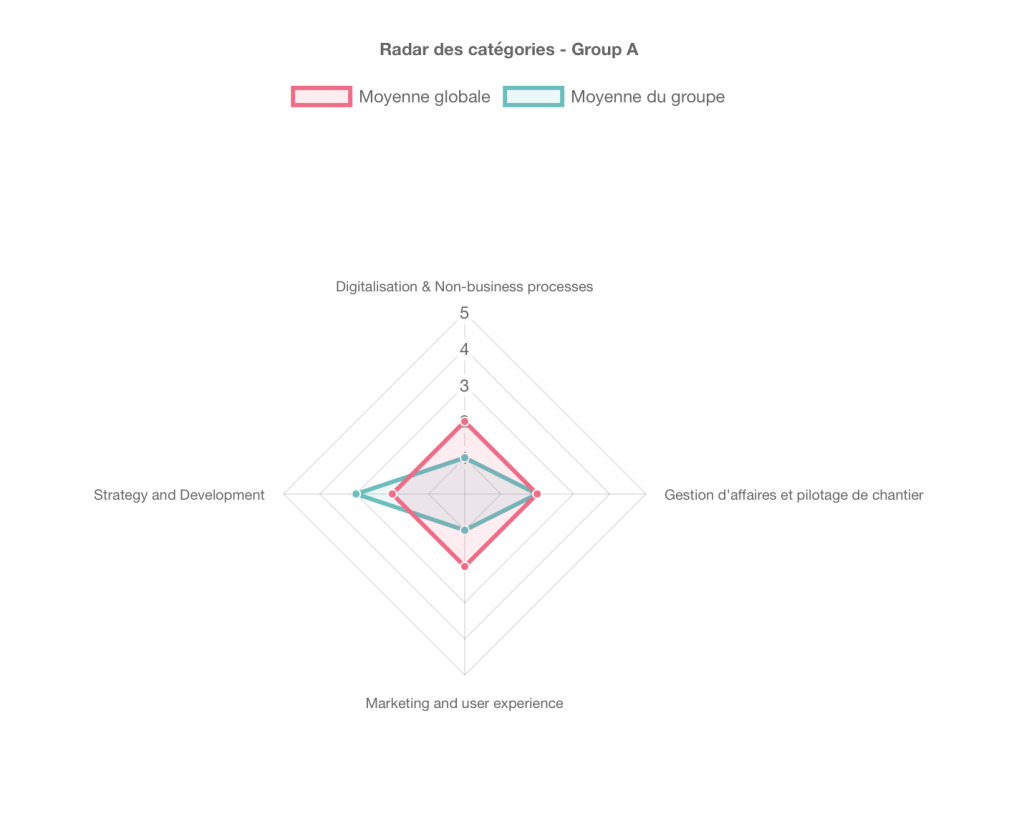
The radar chart: It shows the overall average for all participants in each category (label). The larger the area along a given axis, the higher the average for that category.
Summary table: It displays each student’s average score by category. The last column contains a “Responses” link that takes you to the individual details.
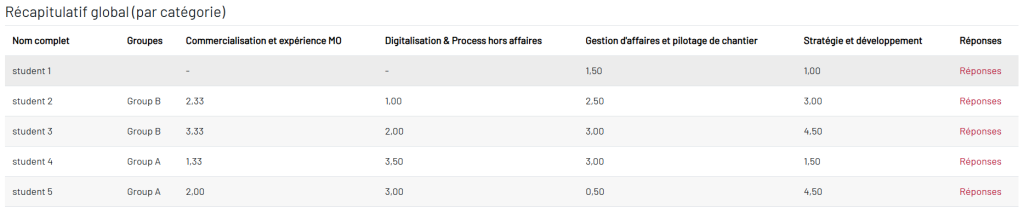
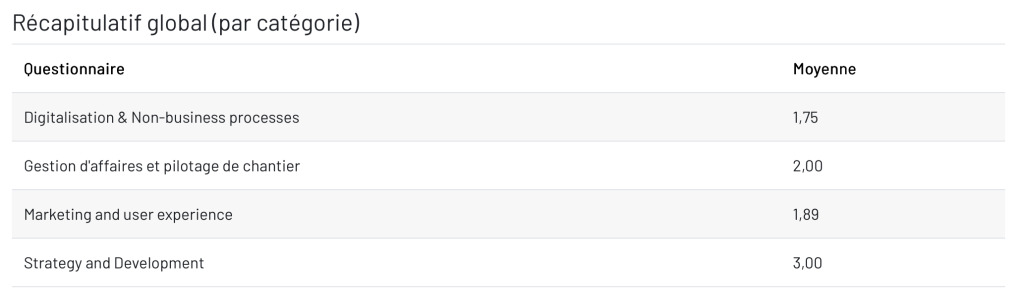
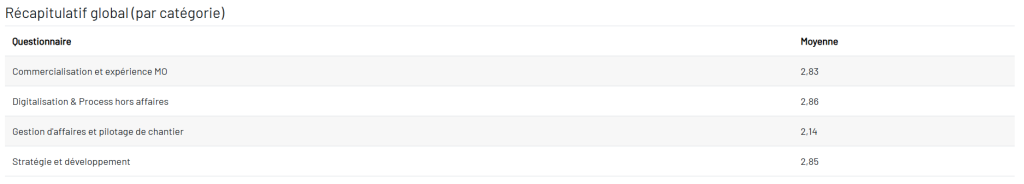
Table of Overall Averages: At the bottom of the page, a second table shows the overall average for all participants in each category.
View a learner’s detailed report #
Step 4: In the summary table, click “Answers” for the learner of your choice.
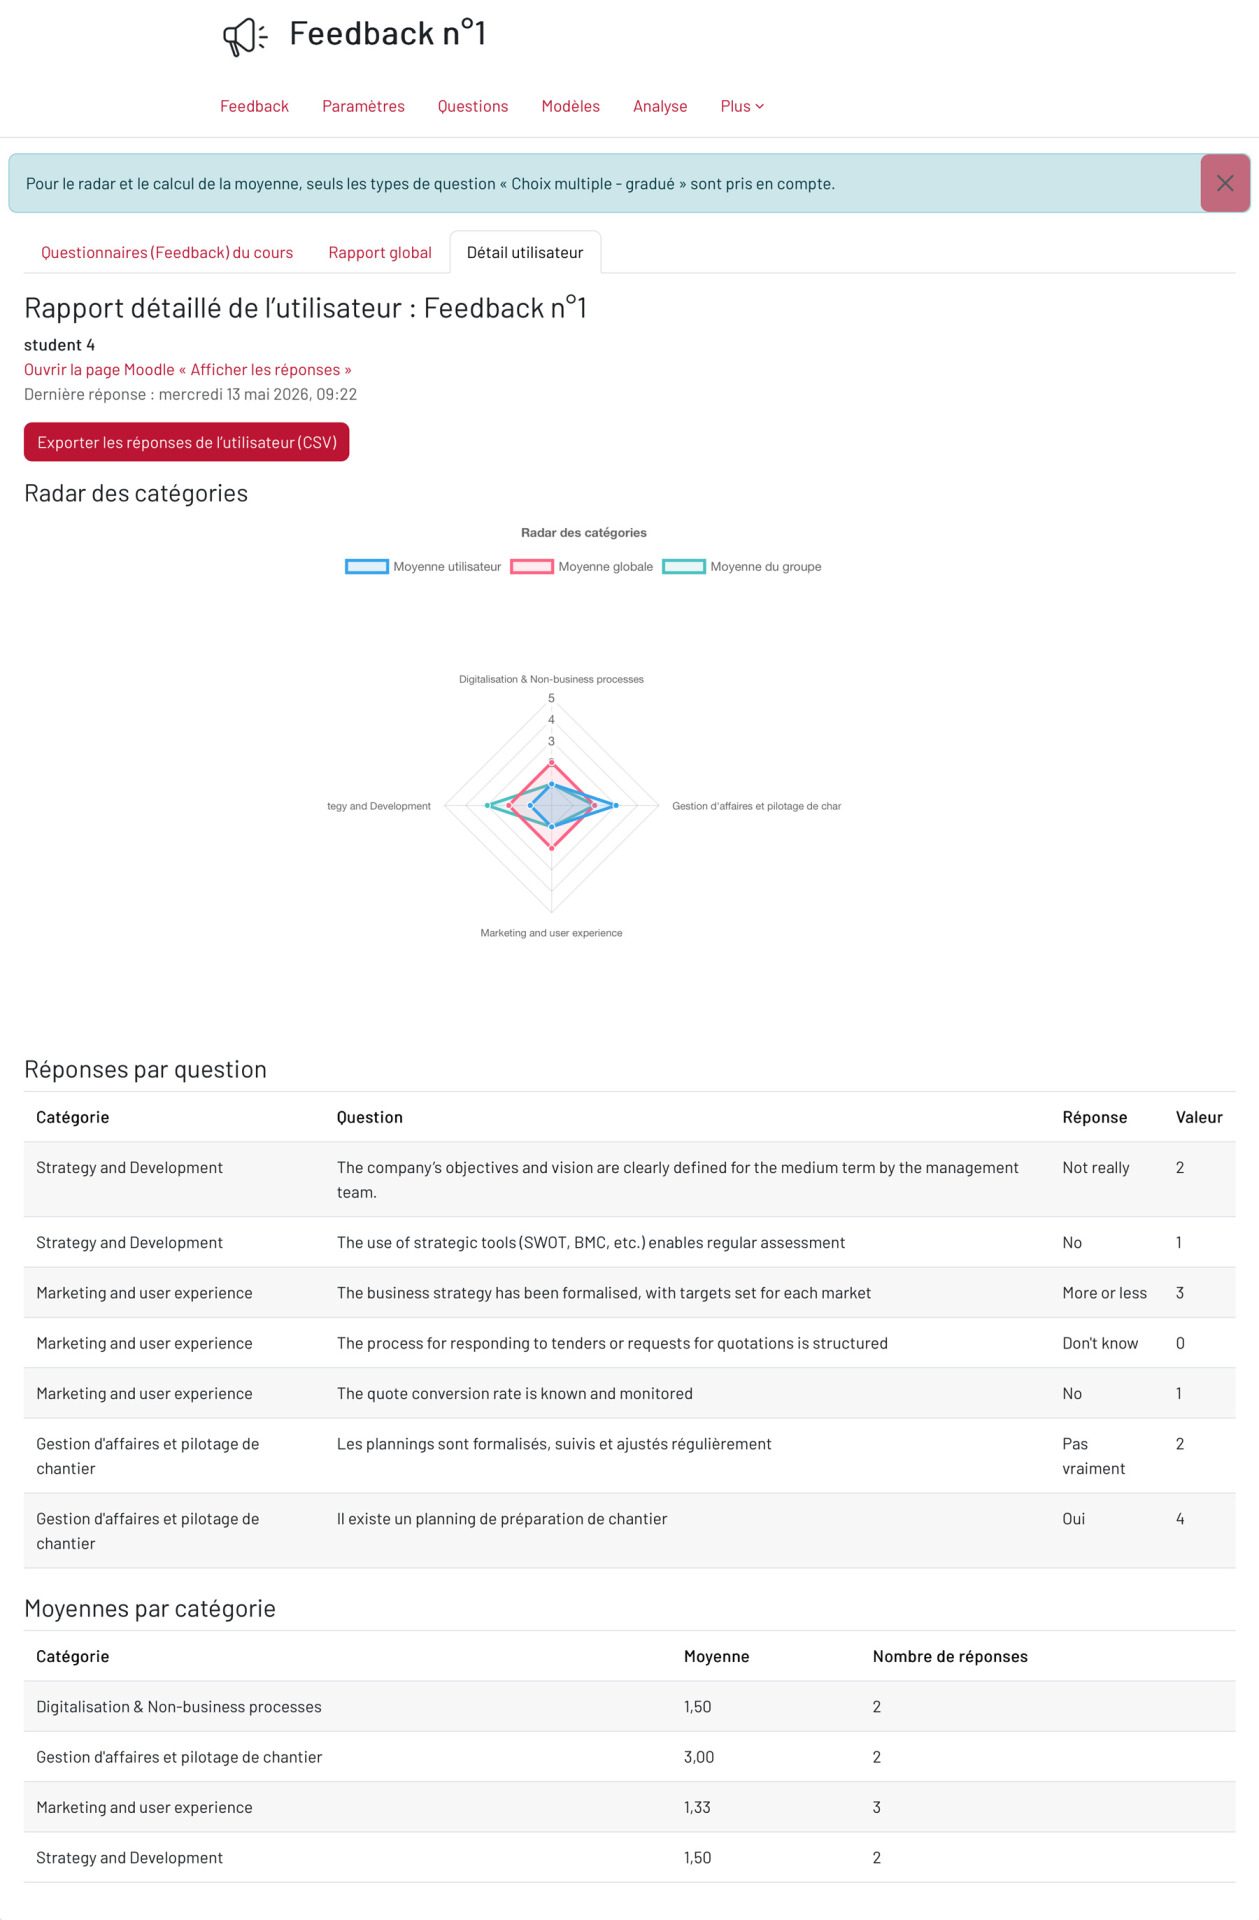
The “User Details” tab opens. It contains:
- A “Export User Responses (CSV)” button
- Le graphique en radar individuel affichant plusieurs courbes :
- this student’s average
- the overall average of all participants
- possibly the average of the group to which it belongs
- A “Answers by Question” table listing, for each question, the category, the title, the answer provided, and the corresponding numerical value
- A table of averages by category for this student
Conclusion #
Feedback Radar integrates directly into Moodle without any complicated setup. If you already use the Feedback activity in your courses, the plugin is ready to use as soon as it is installed: as long as your questions are tagged, the report will be organized automatically.
It is designed for anyone who wants to analyze their survey data without having to export it or use an external tool:
For trainers and teachers: track your learners’ performance by topic, compare individual results to group and course averages, and identify collective strengths or weaknesses without having to sift through raw data.
For educational administrators and institutions: generate clear, easy-to-read reports for training reviews, immediate or delayed evaluations, quality audits, or presentations of results to your teams.
For administrators: Maintain full control over the content displayed and how averages are calculated, exclude irrelevant responses, adjust the visibility of comparison levels, and ensure that the results presented are always meaningful.


