View the results of your Moodle surveys at a glance, organized by topic and presented in graph form
Feedback Radar transforme les données brutes de l’activité Feedback de Moodle en graphique radar et tableaux thématiques — directement dans Moodle, sans export préalable, sans outil externe.
Obtenir Feedback Radar sur la Moodle Marketplace
🐣 Early Bird : 79 $ / an jusqu’au 1er octobre 2026 – Ensuite 59 $ / an
💬 Support inclus avec la licence
Complete documentation available
Moodle 4.5+
and later versions
3 levels of comparison
Learner – Group – Course
CSV export included
Data Ready for Your Spreadsheet
Your Feedback results are here. But analyzing them takes too much time.
Moodle’s Feedback feature generates reports on a question-by-question basis, without grouping by topic or visual representation. Once you have multiple groups, dozens of questions, and different categories, these raw tables become difficult to interpret and impossible to share at a glance.
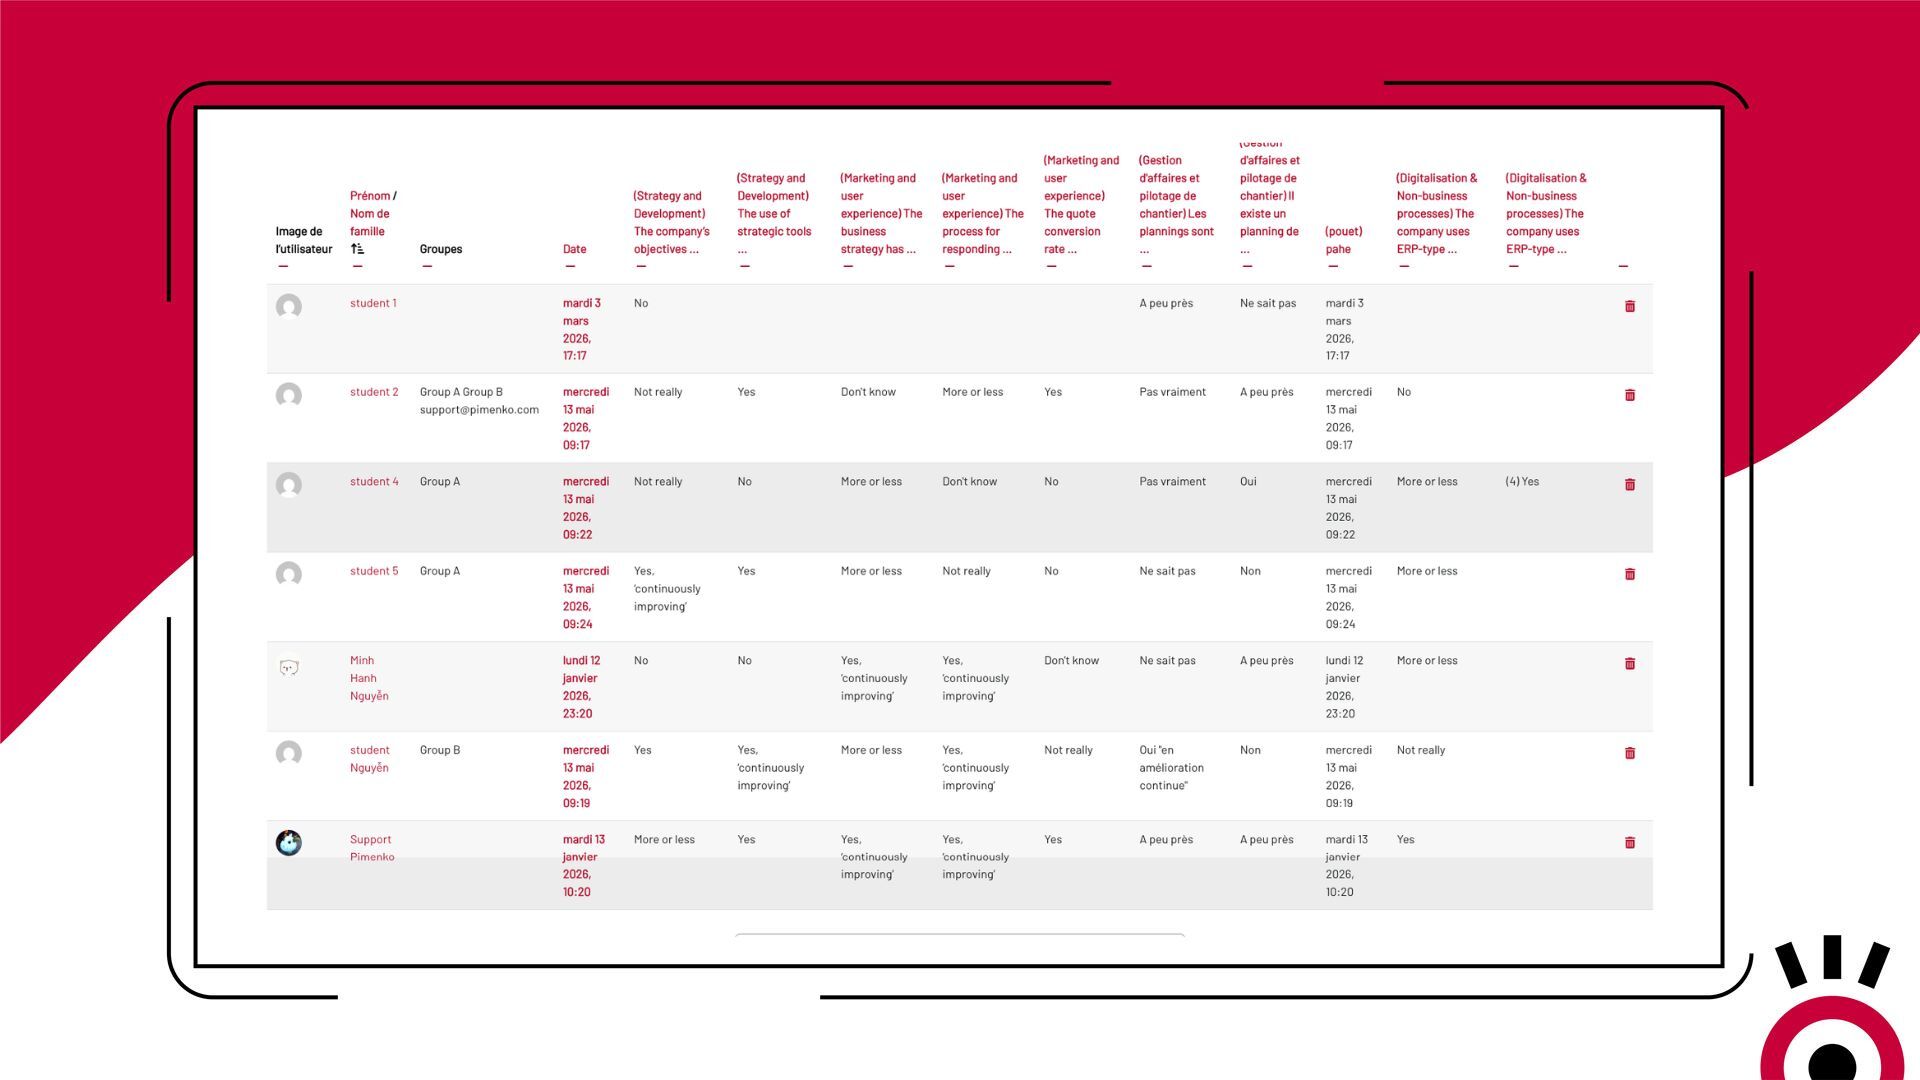
The solution— Feedback Radar—transforms your data into instant visual analytics.
Assign a label to each question in your Feedback activity. Feedback Radar takes care of the rest: grouping, calculating averages, and displaying the results as a radar chart. Everything happens in Moodle—no exporting, no external tools.
Feedback Radar
Find out how Feedback Radar lets you display your feedback results as a radar chart!
Everything Feedback Radar Does
-
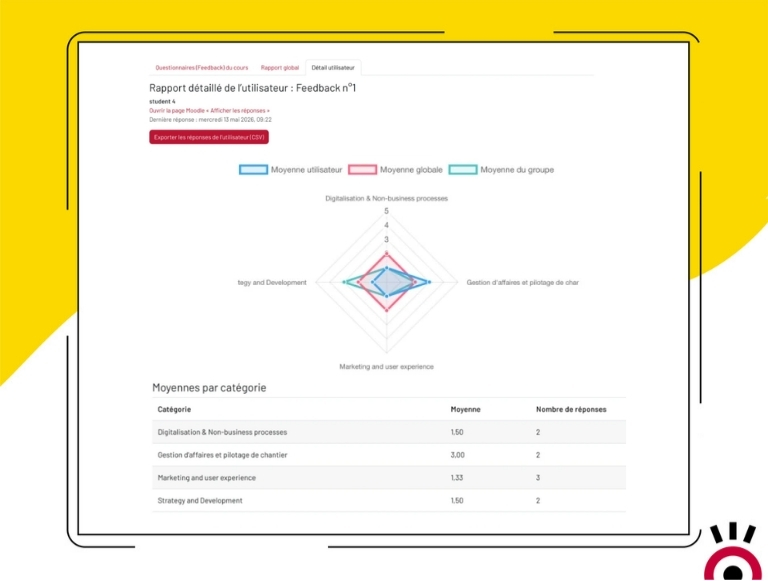
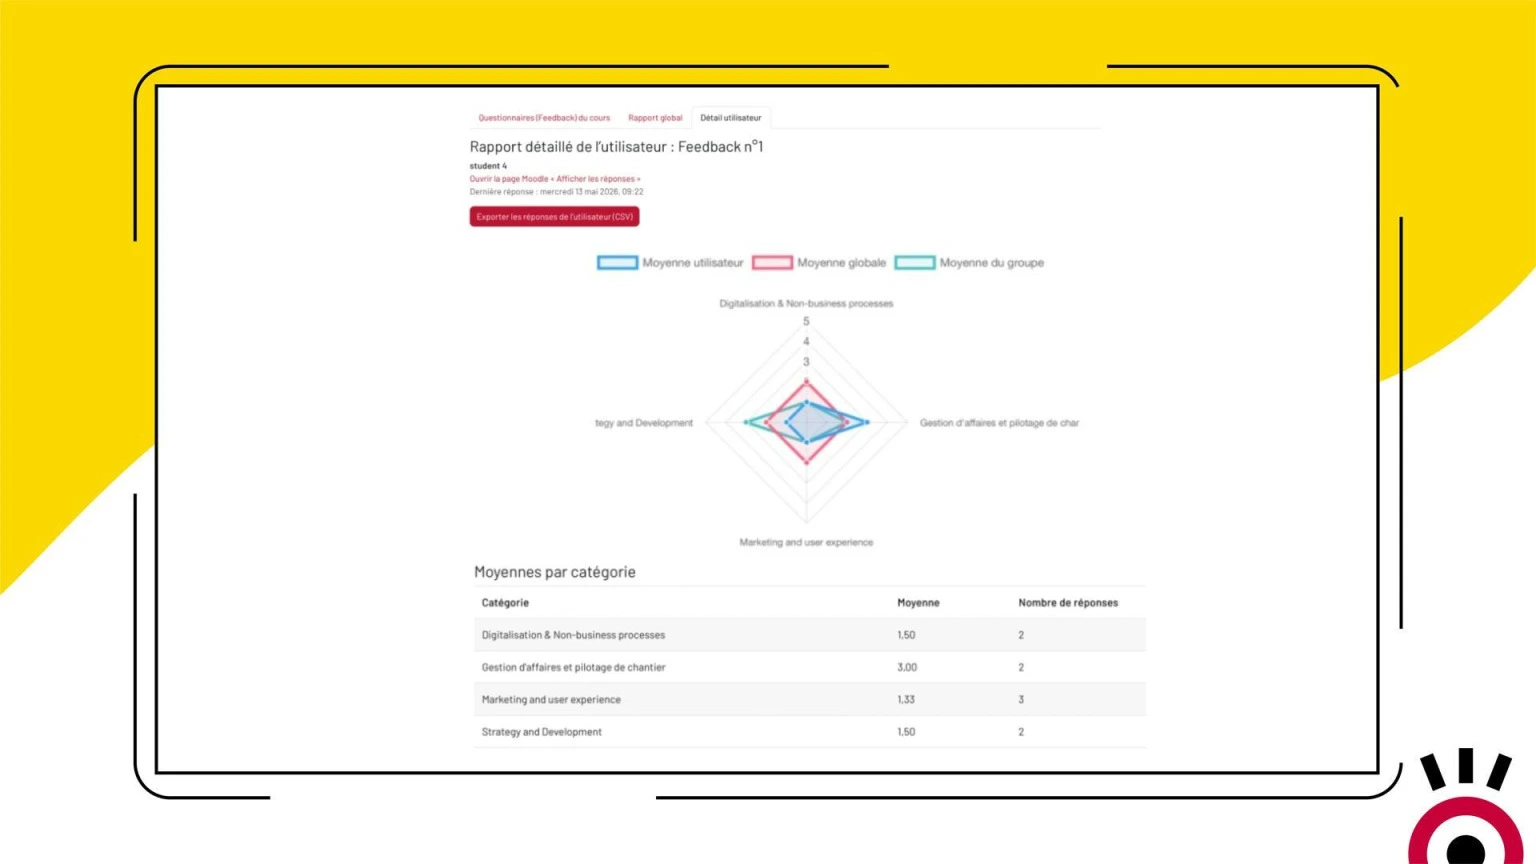
Radar Chart by Topic
The results for each question category are displayed as a spider chart. The larger the area, the higher the results. Instant visual overview of strengths and weaknesses.
-
Automatic grouping by label
Each question has a label in the Feedback activity. Feedback Radar automatically groups them by category and calculates the average rating for each one—without any additional steps.
-
Three levels of comparison in a single graph
Compare a learner’s average, their group’s average, and the overall average for all participants at the same time—all in a single chart, without switching screens.
-
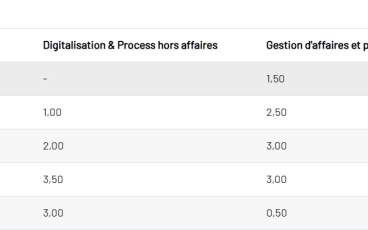
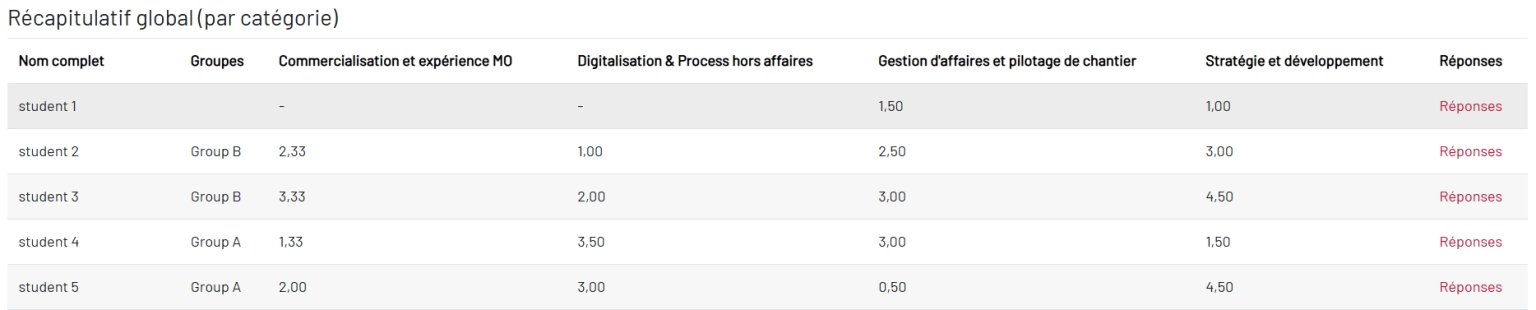
Summary Table of Averages
A table displays each student’s average score by category. A second table shows the overall averages for all participants. Direct access to individual details with a single click.
-
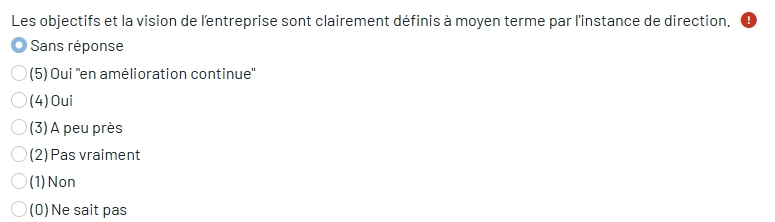
Exclusion of neutral responses
Evusive responses (“N/A,” “I don’t know,” “Prefer not to answer”) may be excluded from the calculation of averages. Freely configure the list of labels to ignore to ensure representative results.
-
Multi-level CSV Export
Export detailed responses by participant, as well as averages by category for each user, by group, or for all participants. Data ready to use in any spreadsheet program.
-
Respect for Anonymity
Feedback Radar adheres to the anonymity settings configured in the Feedback activity. Anonymous responses are included in the overall statistics but excluded from individual reports.
-
Administrator settings
Administrators can enable or disable each comparison level on the radar chart (learner, group, course) independently, depending on the platform’s needs.
-
Ready to use as soon as it is installed
No complex configuration. If your Feedback questions already have labels, the report is available immediately. Just open the Reports tab in your course.
- Accès complet à toutes les fonctionnalités
- Toutes les mises à jour incluses
- Support via tracker
- Compatible Moodle 4.5 & et version suivante
Ready to turn your feedback surveys into analytical dashboards?
Available on the Moodle Marketplace—starting at $59/year (early bird)Frequently Asked Questions
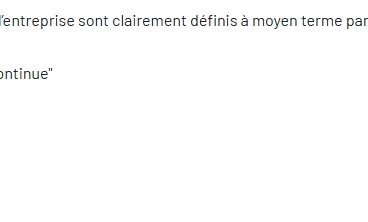
Do I need to reconfigure my Feedback activity to use Feedback Radar?
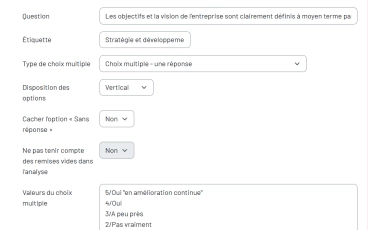
Not necessarily. If your questions are already “Multiple Choice (graded)” and have a label, the report will work immediately. If this is not the case, you must assign a tag to each question in order to enable thematic grouping.
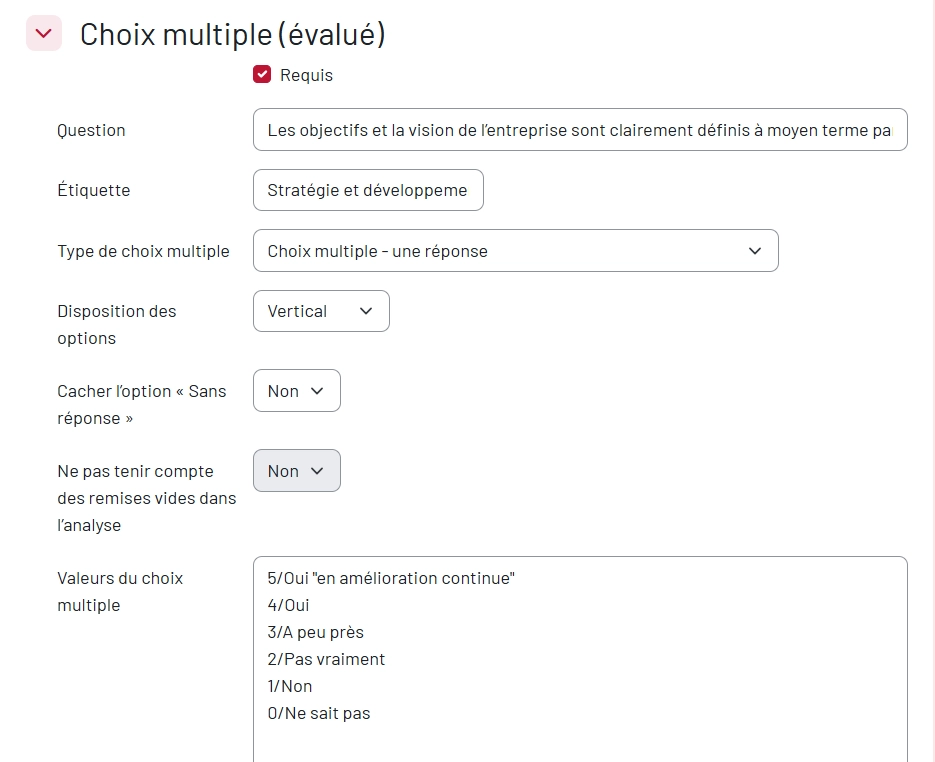
What types of questions are included in the radar chart?
Only “Multiple Choice (Scored)” questions with numerical values assigned to each answer. Other types of questions (open-ended, yes/no, etc.) are ignored when calculating averages.
Can Enroll Synopsis be used for fixed-date training courses or MOOCs?
Yes. If groups have been set up in the course, a filter allows you to display only the results for a specific group, both in the summary table and in the radar chart.
Are anonymous responses taken into account?
They are included in the overall statistics in the graph and the main table. However, they are excluded from the tables relating to individual learners in order to protect confidentiality.
Can the results be exported?
Yes. Two CSV exports are available: detailed responses by participant, and averages by category (by user, by group, or for all participants).
Which version of Moodle is Feedback Radar compatible with?
Feedback Radar is compatible with Moodle 4.5 and all later versions.